
Wednesday, October 29, 2014
I had my lunch today at Efes Doner Restaurant, first time after the new owners took over the place. They have a new menu and have a focus on higher quality food. I found the place cleaner and tidier, and the presentation of food was significantly better. I had a kebab and also tasted their chicken and beef doners. The food was delicious, actually more important for me, it is comparable to the taste that I had in Turkey.
Wednesday, May 28, 2014
Adjusting for differences in wait time target and actual waited time (Scaling or Indexing)
Our job is relatively easy if we have only one queue with the same target wait time for all . We always serve the person with the longest wait. However, in order to uphold the equity principle, we need to have different wait time targets based on the need. If we have 30 individuals waiting for service and if they are distributed across 5 different target time frames, it would be difficult for a human mind to identify who needs to go first while considering equity, equality and fairness. In this case, we need to interpret (adjust) wait times in light of the patient's priority determined by the wait time target. This is called scaling or indexing.
In the example below, there are 12 people waiting for service. Their current wait times and their target wait times are presented. The question is who should go next. The longest waiting person have been there for 56 minutes (case numbers provided as identifiers not for ranking). Even with 12 people, we need to find a method to identify who should go first. Who do you think should go first?
If we purely use First In First Out principle, we can reorder based on their wait time and case #8 has the longest wait time (first in) should go first. But the need or severity of case #8 is different than the need of case #10. It is identified in the target wait time that the case #10 should get service within 5 minutes while the case #8 should get service within 20 minutes. Both cases are above their wait time target, case #8 by 36 minutes and case #10 by 13 minutes. It looks like it is justified that case #8 should receive the service first because s/he waited the longest and also it has the most minutes above its target. However, we can only be sure of our selection between the patients where the wait time targets is same. Certainly between the cases #8, 11, 12, and 3, the case #8 should receive the service first because it waited the longest. But how can we compare the rest to #8?
In order to ensure equity and fairness, we need to use a system to select the person based on the considerations of need and wait time, where scaling or indexing is useful.
Scaling is adjusting the wait time of an individual based on their need. Indexing is the same concept but interprets wait time based on the wait time target. The theory behind both concepts is the same.
What is the value of each time unit for the individual in comparison to others'. If the maximum wait time target is 45 minutes, each minute is 9 times more valuable (or important) for a patient with 5 minute wait time target. In scaling, we multiply each waited minute with 9 for the people with 5 minute wait time target and 3 for the people with 15 minute wait time target. In this case, case #10 would have a scaled (or adjusted) wait time of 162 minutes (18 x 9).
Similarly in indexing we divide the wait time by the wait time target. This will give us the length of wait as a ratio of the wait time target. This is probably easier to understand and, more importantly, easier to explain. Table below show the order of recommended service order for people on the waitlist based on the indexing methodology. Case #10 and #1 climbed to the top of the list.
With scaling or indexing, we eliminated differences between the wait time targets and waited time, and brought all cases to the same level. We can now use the Queue Discipline Ratio (explained in the previous blog entry) effectively for all cases. We don't have several distributions with different wait times. In the indexing model, 1 will always represents the target. We can divide the average indexed value for people who received their service with the average indexed value for people who are currently waiting. Our objective is to achieve the third graph for equitable and fair delivery of service (when there is a waitlist).

In the example below, there are 12 people waiting for service. Their current wait times and their target wait times are presented. The question is who should go next. The longest waiting person have been there for 56 minutes (case numbers provided as identifiers not for ranking). Even with 12 people, we need to find a method to identify who should go first. Who do you think should go first?
| Case Number | Waited Time (min) | Wait Time Target (min) |
| 1 | 16 | 5 |
| 2 | 26 | 10 |
| 3 | 15 | 20 |
| 4 | 20 | 30 |
| 5 | 53 | 45 |
| 6 | 11 | 10 |
| 7 | 8 | 30 |
| 8 | 56 | 20 |
| 9 | 43 | 45 |
| 10 | 18 | 5 |
| 11 | 45 | 20 |
| 12 | 33 | 20 |
If we purely use First In First Out principle, we can reorder based on their wait time and case #8 has the longest wait time (first in) should go first. But the need or severity of case #8 is different than the need of case #10. It is identified in the target wait time that the case #10 should get service within 5 minutes while the case #8 should get service within 20 minutes. Both cases are above their wait time target, case #8 by 36 minutes and case #10 by 13 minutes. It looks like it is justified that case #8 should receive the service first because s/he waited the longest and also it has the most minutes above its target. However, we can only be sure of our selection between the patients where the wait time targets is same. Certainly between the cases #8, 11, 12, and 3, the case #8 should receive the service first because it waited the longest. But how can we compare the rest to #8?
| Case Number | Waited Time (min) | Wait Time Target (min) |
| 8 | 56 | 20 |
| 5 | 53 | 45 |
| 11 | 45 | 20 |
| 9 | 43 | 45 |
| 12 | 33 | 20 |
| 2 | 26 | 10 |
| 4 | 20 | 30 |
| 10 | 18 | 5 |
| 1 | 16 | 5 |
| 3 | 15 | 20 |
| 6 | 11 | 10 |
| 7 | 8 | 30 |
In order to ensure equity and fairness, we need to use a system to select the person based on the considerations of need and wait time, where scaling or indexing is useful.
Scaling is adjusting the wait time of an individual based on their need. Indexing is the same concept but interprets wait time based on the wait time target. The theory behind both concepts is the same.
What is the value of each time unit for the individual in comparison to others'. If the maximum wait time target is 45 minutes, each minute is 9 times more valuable (or important) for a patient with 5 minute wait time target. In scaling, we multiply each waited minute with 9 for the people with 5 minute wait time target and 3 for the people with 15 minute wait time target. In this case, case #10 would have a scaled (or adjusted) wait time of 162 minutes (18 x 9).
Similarly in indexing we divide the wait time by the wait time target. This will give us the length of wait as a ratio of the wait time target. This is probably easier to understand and, more importantly, easier to explain. Table below show the order of recommended service order for people on the waitlist based on the indexing methodology. Case #10 and #1 climbed to the top of the list.
| Case Number | Waited Time (min) | Wait Time Target (min) | Waited Time Indexed to Target |
| 10 | 18 | 5 | 3.6 |
| 1 | 16 | 5 | 3.2 |
| 8 | 56 | 20 | 2.8 |
| 2 | 26 | 10 | 2.6 |
| 11 | 45 | 20 | 2.3 |
| 12 | 33 | 20 | 1.7 |
| 5 | 53 | 45 | 1.2 |
| 6 | 11 | 10 | 1.1 |
| 9 | 43 | 45 | 1.0 |
| 3 | 15 | 20 | 0.8 |
| 4 | 20 | 30 | 0.7 |
| 7 | 8 | 30 | 0.3 |
With scaling or indexing, we eliminated differences between the wait time targets and waited time, and brought all cases to the same level. We can now use the Queue Discipline Ratio (explained in the previous blog entry) effectively for all cases. We don't have several distributions with different wait times. In the indexing model, 1 will always represents the target. We can divide the average indexed value for people who received their service with the average indexed value for people who are currently waiting. Our objective is to achieve the third graph for equitable and fair delivery of service (when there is a waitlist).
Friday, May 16, 2014
Prioritization and Queue Discipline
Prioritization and Queue Discipline
In the previous post, I finished with the discussion regarding the prioritization and queue discipline and argued that the service needs to be provided equitably, equally and fairly.
Equitable service delivery requires giving a higher priority for people who has a higher need for service. Person who is unable to walk should get the hip surgery earlier than a person who is able to walk. The quality of life of the person who can't walk has deteriorated more than the one who can walk. In order to identify who has the most need, a prioritization method is required. The prioritization method needs to consider several variables, such as current status of illness, speed of disease progression, the impact of the disease, and social factors. It would be ideal to find tools that can provide an objective assessment of the variable(s) but it is not likely to find one for all possible problems. Here are some examples.
Of the two people who has Parkinson's, the person whose disease progresses faster can have the deep brain stimulator earlier.
|
|
Impact of the disease
(life or limb)
|
A person who has cancer should receive services earlier because the delay could result in loss of life. A person who has malignant melanoma should receive services earlier than a person with spinocellular carcinoma because maligant melanoma has a higher potential for spread.
|
Social factors
|
The weights of these factors in determining priority might be different but, at the end, a priority must be given to each individual. Ideally, individuals should be able to compare their priority against the others' on the waitlist. Having transparency of the waitlists satisfies the need for fairness.
Equal access to services means a person with a particular need should access the services in the same time frame across service providers. For example, if there are five outpatient clinics of a hospital (or five physicians in the practice), all persons who have the same priority should have same average wait time for the services. This ensures that other conditions, such as location, culture, race, language, income, employment, etc. are not factors in accessing the services.
Fairness means you access the services based on your priority and the time that you waited must count for something. You would not wait endlessly for a service and pushed constantly to the end of the queue because people with more urgent conditions arrive. However, this may happen in waitlist management for the following reasons.
- Either more urgent cases come (who has the same priority but due to factors that are not captured in the priority) and bump the cases who are on the list to the end of the list.
- People who are waiting cannot get their turn when called and they continue waiting. For example, for surgical waitlist, when the patient was given a surgery date and they can't accept it because they are recovering from another ailment, or they have planned to go somewhere, etc.
- There are external forces to encourage selecting patients who waited less. When there is performance measure of percent served within their target wait time and it is calculated based on people who received their service, service provider may inclined to provide service to people who are not above their wait time target first in order to ensure their performance is high.
- Lastly, as human brain cannot process data easily, we tend to remember the patients that we have seen recently and tend to engage in discussion with them and provide service to them earlier. People who were waiting for a long time continue to wait.
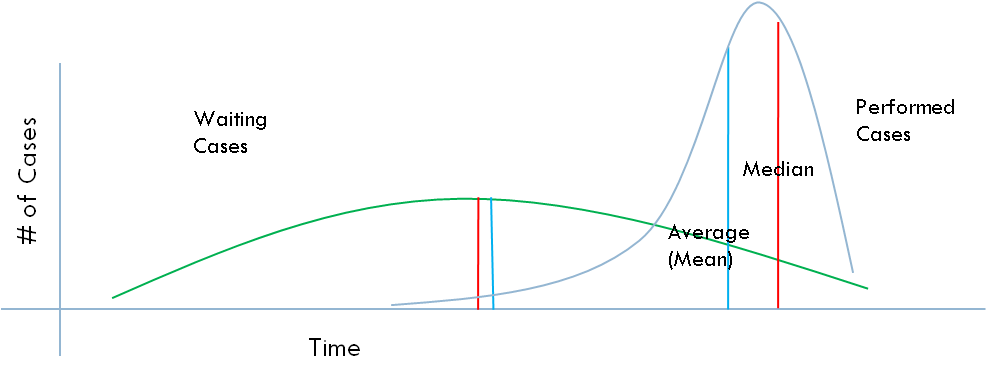
How does the distribution of cases look like against their target, if above factors influence the decision to select patients/customers from the list? For the sake of argument, lets call this First-In- Last-Out (FILO).

People who receive the service receive (above graph performed cases indicating that the patients received their surgery) significantly earlier than the cases waiting during the same time period.
If we randomly select the cases from the waitlist, sometimes we will select a patient that just started waiting and sometimes a patient that has the longest wait time. The distribution will look like a normal distribution. Let's call this random selection (RS)
 In this case, eveybody on the waitlist has an equal chance of being picked at any point. The average wait time for performed cases and the waiting cases would be exactly the same (or close).
We get the person who waited the longest from the end of the queue (in-turn). This uses the First-In-First-Out (FIFO) principle.
If we randomly select the cases from the waitlist, sometimes we will select a patient that just started waiting and sometimes a patient that has the longest wait time. The distribution will look like a normal distribution. Let's call this random selection (RS)
We get the person who waited the longest from the end of the queue (in-turn). This uses the First-In-First-Out (FIFO) principle.
In this graph, the wait time for the cases waiting at any time is shorter than the cases that received their service. There may be some cases that receive their services earlier but this is certainly not the norm. I don't know which queue among the above three you would like to be in but I certainly prefer the last one.
Based on this view, the IRMACS at the Simon Fraser University (http://www.irmacs.sfu.ca/) came up with a basic indicator. Let's call it Queue Discipline Ratio. It is simply the division of average wait time for performed (or people who received their service) cases by the average wait time for the waiting cases. Random selection will give you a number around 1. The higher the number the more closer the queue discipline to FIFO.
This is quite easy to implement if we have only one queue without differing priorities. What if we have several priorities, can we actually use this? Next post will cover this. Here is an example.
Blue lines are the cases performed (or received their service) and red lines are the cases still waiting with a particular priority. How can we achieve, and track, queue discipline for this waitlist?
Friday, May 2, 2014
Managing your Waitlist - Overview
A lot has been written about how to reduce and eliminate waitlists. This post is not concerned about reducing or eliminating waitlists but understanding your waitlists and how to manage them. The solution alternatives for reducing or eliminating waitlist are political and complex decisions and much has been written about them. Again my focus here is how can we manage the existing waitlist.
Number of people coming on the
your waitlist presents the load on the waitlist, it is measured by a time period. It is important to know the volume of arrivals, especially if you have control over the resources, you can plan for the supply. The gap between the number of people processed (or removed from the waitlist) versus the number that added on the waitlist indicates the whether your waitlist is growing or shrinking. In surgical waitlists, this is the number of patients booked for surgery; in a physician office this number of referrals or number of people who request an appointment. You wouldn't expect your local grocer to have only one cashier all day every day. You would expect them have more cashiers at peak times. This is why knowing the volume of arrivals and understanding the fluctuations in the number of arrivals is important.
Patient satisfaction is a function of the difference between the perceptions and expectations. If we can deliver service earlier than patient's expected wait time or deliver service within the perceived wait time, patients are likely to be satisfied.
For emergency or drop-in services queue is generally visible. For elective (or appointment based) health care services, there is no visible queue. However, it is still important have a sense of the number of people waiting or more importantly number of people waiting against the capacity. The number of people waiting against capacity is a more valuable indicator, particularly if one wants to keep a certain level of demand for counteract fluctuations in demand, for example one week or one month service equivalent of demand (waitlist). If you are a restaurant operator, may be half-an-hour of demand is all what you can hope for.
***************************
2 Sridar, MS. (unknown) Waiting Lines and Customer Satisfaction, downloaed May 1, 2014 from www.researchgate.net/...Waiting_Lines.../d912f50a3d915e080f.pdf
3 Lofvendahl et al (2005) Waiting for orthopaedic surgery: factors associated with waiting times and patients' opinion, International Journal of Quality in Health Care, V.17, No.2, pp.133-140
4 Davis, M.,Heineke, J (1998) How disconfirmation, perception and actual waiting times impact customer satisfaction, International Journal of Service Industry Management, V.9, No.1, pp.64-73
5 Conner-Spady, B et al (2011) The importance of patient expectations as a determinant of satisfaction with waiting times for hip and knee replacement surgery, Health Policy, V.101, pp.245-252
Here is what we need to know for effectively managing the waitlist.
Arrivals
Capacity
Depending on the business, this might be number of people working and existing infrastructure (e.g. number of cubicles, or number of check-out terminals, number of operating rooms, number of examination rooms, number of ultrasound machines). For example, the capacity question in the surgical waitlist may not be the number of surgeons available but number of hospital beds available because the hospital beds might be the determinant of the throughput rather than the surgeons or OR capacity. Knowing the the determinants of the throughput and their impact on the waitlist is critical. The determinant of the throughput will change as the capacity in various part of the flow changes. If you suddenly given 20 hospital beds (or two additional examination rooms) the determinant may become OR time (or available staff). It is important to have a map of all items that determine the capacity on a particular flow, identify the maximums and minimums required based on the arrivals.Capacity planning involves the volume of arrivals, the volume of waitlist that you would like to have and the acceptable perceived wait time.
Queuing theory, advance access and simulations using these are some of the tools to match the waitlist and wait time to the existing capacity. These tools would also help with exploring the possibilities of reorganizing service provision in order to use the existing resources more efficiently. For example, if the service that is provided is a standard one and it doesn't matter who provides the service (e.g. airport check-in) one single queue and first available provider is the most efficient model. But if personal relationship is important or you have other objectives (such as having customers to hang out longer in front of magazines and candy) then having separate lines and allowing customers (patients) to choose their providers might be a better option.
Queuing theory, advance access and simulations using these are some of the tools to match the waitlist and wait time to the existing capacity. These tools would also help with exploring the possibilities of reorganizing service provision in order to use the existing resources more efficiently. For example, if the service that is provided is a standard one and it doesn't matter who provides the service (e.g. airport check-in) one single queue and first available provider is the most efficient model. But if personal relationship is important or you have other objectives (such as having customers to hang out longer in front of magazines and candy) then having separate lines and allowing customers (patients) to choose their providers might be a better option.
Wait Time
Time between the start and the end of wait identifies how long individuals wait for service. When the wait starts and when it ends may differ depending on the perspective. For example, while the wait starts for the patient when a decision is made, the wait may only start for the provider organization when patient contacted them.
The critical factor in wait time is not the actual wait time but the users' perceived wait time. This determines the satisfaction with the waiting. There are factors affecting the perceived wait time. For example, literature suggests that knowing accurately how long one will wait,
communicating with the system and other waiters during the wait, and keeping
active during the wait reduces the perceived wait. More specifically unoccupied time, reprocess waits, uncertain waits or anxiety during waiting, unexplained and unfair waits, and solo waits seem longer than occupied time, in-process waits, known waits, explained waits, and group waits1,2.Patient tend to value short waiting times and also the possibility of influencing the date/time of the service (e.g. appointment, surgery)3.
Lets consider some examples of reducing perceived wait for a physician office or surgery.
Characteristic
|
Physician Office
|
Surgical Services
|
Knowing expected wait time
|
Estimated time that physician sees you. e.g. You will be seen in 20 minutes.
|
Expected date of surgery (or the expected week that surgery is going to be scheduled).
|
Communicating
|
Talking with the medical office assistant, acknowledgement of your arrival, estimated wait time, and reviewing anything related to your patient file.
|
Updates from the surgical system, meeting with other patients who are waiting for the same surgery (physically or virtually) and possibly tracking and submitting your improvement to the surgical system (see below)
|
Keeping Active
|
Completing a specific or general assessment of your health (e.g. SF-36, Euro-Qol) and receiving a comparison where you were in the past.
|
Getting ready for surgery with exercise regiments (e.g. pulmonary conditioning, diabetes control), physiotherapy support (muscle strength), and education.
|
Patient satisfaction is a function of the difference between the perceptions and expectations. If we can deliver service earlier than patient's expected wait time or deliver service within the perceived wait time, patients are likely to be satisfied.
- We can improve their satisfaction with providing equitable, equal and fair service4,5.
- We can improve their satisfaction by providing information to set reasonable expectations4
- We can improve their satisfaction by involving them in activities, groups and constant communication and not allowing them to have a lonely waiting experience, their perceived wait time would decrease4.
Maximum Length of Waiting Line
From the service point of view, having a wait list (or waiting line) is good. As a manager of the service, you can maximize the use of your resources. You can keep your productivity on a higher level. If you are restaurant operator, you may want to increase your table occupancy rate by keeping a waitlist. However, there needs to be a balance between the length of the waitlist and users perception of an acceptable waitlist. Users of the service should consider getting in line and should not be overwhelmed with the length of the waiting line that they should search for an alternative service or provider.For emergency or drop-in services queue is generally visible. For elective (or appointment based) health care services, there is no visible queue. However, it is still important have a sense of the number of people waiting or more importantly number of people waiting against the capacity. The number of people waiting against capacity is a more valuable indicator, particularly if one wants to keep a certain level of demand for counteract fluctuations in demand, for example one week or one month service equivalent of demand (waitlist). If you are a restaurant operator, may be half-an-hour of demand is all what you can hope for.
Prioritization and Queue Discipline
If you are waiting for your service, you want to be sure that the service is provided equitably, equal and a fair way. What do I mean by equitable? Equitable means that you receive the service based on your needs. For example, one would not expect that a person who is having a heart attack waits as long as the patient who has an ankle sprain. In this case, we expect that the person with higher need goes first. What do I mean by equal? Patients who have the same need should access the same opportunity to services. In other words, all people who are waiting for an x-ray for their sprained ankle should wait the same amount of time. What do I mean by fairness? There needs to be justice in service access. The time that one waited should count for something. It should not be fair for anyone to wait for 24 hours in the emergency because there is constant flow of more urgent patients. At one point, the waited time should enable the individual to become urgent. I will explore the prioritization and queue discipline in the next post.***************************
2 Sridar, MS. (unknown) Waiting Lines and Customer Satisfaction, downloaed May 1, 2014 from www.researchgate.net/...Waiting_Lines.../d912f50a3d915e080f.pdf
3 Lofvendahl et al (2005) Waiting for orthopaedic surgery: factors associated with waiting times and patients' opinion, International Journal of Quality in Health Care, V.17, No.2, pp.133-140
4 Davis, M.,Heineke, J (1998) How disconfirmation, perception and actual waiting times impact customer satisfaction, International Journal of Service Industry Management, V.9, No.1, pp.64-73
5 Conner-Spady, B et al (2011) The importance of patient expectations as a determinant of satisfaction with waiting times for hip and knee replacement surgery, Health Policy, V.101, pp.245-252
Friday, November 20, 2009
Podcast from CBC's White Coat Black Art regarding H1N1
White Coat Black Art (WCBA) is an interesting CBC Radio program prepared by Dr. Brian Goldman. The following is a link to WCBA's podcast regarding the H1N1 pandemic, broadcasted on September 19, 2009.
http://podcast.cbc.ca/mp3/whitecoat_20090919_20419.mp3
You can find all podcasts of WCBA at www.cbc.ca/podcasts
Happy listening.
http://podcast.cbc.ca/mp3/whitecoat_20090919_20419.mp3
You can find all podcasts of WCBA at www.cbc.ca/podcasts
Happy listening.
Monday, November 2, 2009
My decision for H1N1 Vaccination
Should I get H1N1 vaccination? Most people (especially if they are not in the high risk group) are asking this question. Public Health officials are pushing for vaccination but there is not enough vaccine out there for everybody. Supplier firm over-represented the volume they can produce, and health officials likely underestimated the impact of their social advertising on people and this resulted in short supply of vaccine. Should I get worried?
Here is my take of the situation. I believe that my family and I will get vaccinated eventually, unless we get H1N1 before our turn for vaccination. I am not panicking about this and I also think that nobody who does not not have underlying health conditions should. The following presents why I made this decision, hopefully it would help you to make your decision too.
What is the Problem here?
New Scientist writes that H1N1 is a virus that has been circulating since 1889. It is believed that 1918 Spanish flu was also an H1N1 virus and killed 50 Million people (3% of world population) and 1/3 was infected. In 1918, 1 in every 10 infected people died. Most deaths were due to secondary bacterial lung infections. This is before the time of antibiotics. The first modern antibiotic Penicillin was found in 1928 and mass produced in 1942. The rate of H1N1 infection (and consequently number of deaths) would be significantly less now both because of our ability to deal with secondary infections and also the vast improvements in hygiene.
H1N1 circulated until 1957 therefore it is believed that people who were born before 1957 has natural immunity. H1N1 was dormant until 1976; in the same year a strain of H1N1 jumps the species barrier, from pigs to humans resulting in a mass vaccination campaign. The predecessor of 2009 H1N1 appears in 1998 as a combination of human, pig and bird flu viruses.
H1N1 is a highly contagious virus but it is not a deadly one. It affects younger people because older generations possibly have immunity to the virus through past epidemics. The current strain of H1N1 is living together with seasonal influenza (H2N3) and this indicates to me that H1N1 is here to stay for a while.
US CDC estimates that for every confirmed case, there is likely a median of 79 actual people infected with the virus. By the end of October, in Canada, 22,000 people tested, of those 14,860 of them had Influenza A, and 9,418 were H1N1.
Of the H1N1 infections 948 were hospitalized, 147 were admitted to ICU and 24 were died. Of the 24, only 2 were announced to have no secondary health problems. If there were 9,418 confirmed H1N1 cases, based on CDC’s research approximately 744,000 Canadians were infected with H1N1. So if you are healthy and get H1N1, then your risk of dying from H1N1 is 1 in 370,000. If you have secondary conditions than your chance of dying from H1N1 is 1 in 33,000. Of course, these are very broad estimates.
In 1976, 48 million people were vaccinated against H1N1 and 532 people got Guillain-Barre Syndrome and 25 died. The risk of Guillain-Barre syndrome was 1 in 90,000 people and except for 25 all recovered. The risk of Guillian-Barre with current day flu vaccines is no more than 1 in 1,000,000. Over the 33 year period, vaccine production technology has also improved.
During the initial tests before the release of the H1N1 vaccine, 96 percent of people who were vaccinated against H1N1 developed immunity within 21 days after vaccination. The short term complications of H1N1 were local swelling and inflammation; no serious complications were reported. After millions of doses dispended, there may be a better idea of the vaccine complications in the coming months.
The last question I have is the use of Tamiflu (Osteltamivir) for treatment of H1N1. Osteltamivir shown to reduce the length of the flu (not H1N1) from 5.3 days to 4.4 days and reduced flu related complications by 11 percent. Another study showed that Osteltamivir reduced the non-bacterial pneumonia by 4 percent. For ease of calculation and the reason of death in H1N1 infections is the non-bacterial pneumonia, I will consider that Osteltamivir reduces the risk of death by 5 percent. In terms of complications of Osteltamivir, 5 percent of children developed who took Osteltamivir developed vomiting. Other complications included gastrointestinal symptoms, diarrhea, headache, tiredness and difficulty in concentration.
My Objective
My objective is to reduce harm that can be caused by H1N1 flu.
Alternatives and Consequences
1. Take the risk to get the flu: Possibility of infection is 1 in 30 but I will estimate somewhere between 1918 Spanish flu and current status, and use 1 in 15; dying from it 1 in 370,000. Therefore, my overall risk of death from H1N1 is 1 in 5.55 million.
2. Take the risk to get the H1N1 but use Osteltamivir to reduce the impact of the disease: If Osteltamivir makes a 5 percent improvement in non-bacterial pneumonia, lets assume that it would be reducing the risk of dying by the same amount, therefore dying from H1N1 would be 1 in 5.827 million with possible complications between 5 to 10 percent of vomiting, gastrointestinal problems, and may be additional headache.
3. Get vaccinated: Possibility of having a serious complication is 1 in 1 million, likelihood of dying from H1N1 is 1 in 111 million. Only 4 percent might get infected with H1N1, and their likelihood of death is 1 in 5.55 million.
If you look at risk of death, vaccination reduces the likelihood of death by 22 times. It is beneficial to get vaccinated and I decided to get vaccinated. But if you are comparing the dis-ease that H1N1 would cause versus the likelihood of serious vaccine complication (1 in 1 to 2 million), then it becomes a value judgement which one must include questions like "would I contact with people who has secondary conditions?" because they are 10 times more vulnerable to disease then people without secondary conditions. In addition, the fewer the number of people vaccinated, the more likely more people get infected and H1N1 will be around longer as infection would be able to find people without immunity.
People also worry about the adjuvant in the vaccine. Non-adjuvant vaccine will be available but it is likely that the effectiveness of the vaccine would decrease. The decision to wait for non-adjuvant vaccine can not be effectively made until vaccine effectiveness and comparison against possible short term and long term complications of adjuvant are available. My preference is to get non-adjuvant vaccine, if available, which may require me to have two shots rather than one.
Good luck with your decision.
Subscribe to:
Posts (Atom)